This web page was produced as an assignment for Genetics 677, an undergraduate course at UW-Madison
Phylogeny
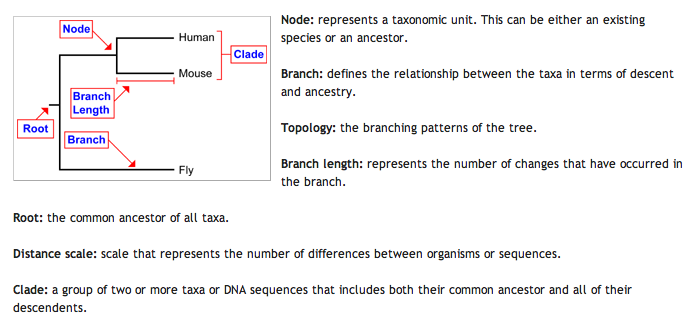
Phylogeny is the comparison of multiple sequences, either gene or protein, to determine the potential relation between different species. This can be done on an entire genomic or proteomic scale or it can also be done for individual genes or proteins. The comparisons lead to a physical representation known as a phylogenetic tree. The tree shows how far away the different species or genes are from each other which hints at the evolutionary history of the species and/or gene. The different features of a phylogenetic tree are defined below. This diagram was created by Professor Skop for the use of the students in Genetics 677, an undergraduate course at UW-Madison (4).
Clustal W Omega Tree
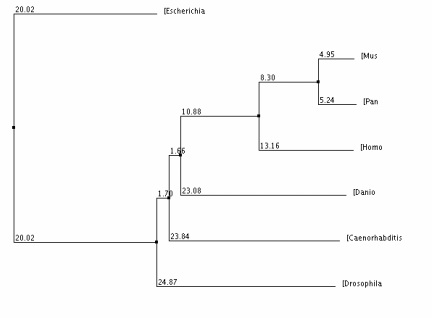
The phylogenic tree to the left was made with the program Clustal W Omega (1, 3) by comparing the protein sequence between the homologous proteins of selected species. The homologous proteins used can be found on the homologs page.
I used the protein sequences to build my phylogenic trees to simplify the process. The proteins are between 462 amino acids and 523 amino acids long while the genetic sequences of the corresponding genes are between 1400 and 1600 nucleotides. The protein sequences are first aligned by the Clustal W program which can be found here. The program then compares the similarities and differences between each protein sequence to determine how closely related the proteins are to each other. The tree also shows the relative distances of each branch.
I used the protein sequences to build my phylogenic trees to simplify the process. The proteins are between 462 amino acids and 523 amino acids long while the genetic sequences of the corresponding genes are between 1400 and 1600 nucleotides. The protein sequences are first aligned by the Clustal W program which can be found here. The program then compares the similarities and differences between each protein sequence to determine how closely related the proteins are to each other. The tree also shows the relative distances of each branch.
Phylogeny.fr Tree
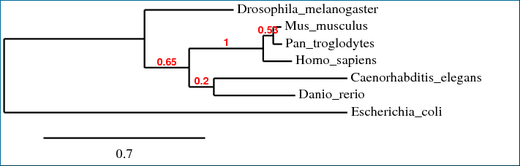
This tree was created by the program available at Phylogeny.fr using the "One Click" setting (2). This program runs on the same principles as the Clustal W program but they utilize different equations to reach their conclusions. This can lead to slight discrepancies between the two trees.
Analysis
There is not much difference between the two phylogenetic trees. It may appear initially that there is a lot of difference but this is only due to the fact that E. coli and D. Melanogaster have switched positions but this switch is only aesthetic. E. coli is still the outermost species and D. melanogaster is still the second outermost species. You must remember that a tree can be rotated around nodes without changing the information that is being displayed. The major difference between the two trees is that in the Phylogeny.fr tree the C. elegans and D. rerio proteins are put into a clade but in the Clustal W tree they are not. I do not know what the reason is for the difference but it does not have much importance to our research since we are focusing more on the human (SLC7A11) and fly (genderblind) proteins and any discrepancies that might involve either of the two. The overall structure of both trees is reminiscent of the evolutionary tree where the more complex animals are more closely related than they are to less complex organisms. The mammals are all located in the same clade and the further out you go in the tree the less complex the organisms are, ending with the outermost organism being E. coli.
References
(1) A new bioinformatics analysis tools framework at EMBL-EBI (2010) Goujon M, McWilliam H, Li W, Valentin F, Squizzato S, Paern J, Lopez R Nucleic acids research 2010 Jul, 38 Suppl: W695-9
(2) Dereeper A., Guignon V., Blanc G., Audic S., Buffet S., Chevenet F., Dufayard J.-F., Guindon S., Lefort V., Lescot M., Claverie J.-M., Gascuel O. Phylogeny.fr: robust phylogenetic analysis for the non-specialist Nucleic Acids Research. 2008 Jul 1; 36 (Web Server Issue):W465-9. Epub 2008 Apr 19.
(3) Fast, scalable generation of high-quality protein multiple sequence alignments using Clustal Omega Sievers F, Wilm A, Dineen DG, Gibson TJ, Karplus K, Li W, Lopez R, McWilliam H, Remmert M, Söding J, Thompson JD, Higgins D Molecular Systems Biology 7 Article number: 539 doi:10.1038/msb.2011.75
(4) Skop, Ahna. "Homology & Phylogeny." Gen677. Web. 22 Apr. 2012. <http://gen677.weebly.com/homology--phylogeny.html>.
